
A review of the 2018 IPCC Special Report on 1.5°C shows that all four archetype scenarios (P1, P2, P3 and P4) make use of sinks – or the ability to remove carbon dioxide from the atmosphere and store it geologically or retain it within the land. The reasons for needing to do this fall into two categories;
- The point at which net-zero emissions is required (i.e. 2050) comes before all anthropogenic emissions can be stopped, so remaining emissions have to be balanced with sinks to remove the same amount of carbon dioxide from the atmosphere as added by remaining sources.
- By the time net-zero emissions is reached, the carbon dioxide load in the atmosphere has exceeded that associated with 1.5°C of warming, so sinks are required to lower atmospheric levels at a faster rate than natural decline, ensuring a 1.5°C or lower outcome by the end of the century.
The four scenarios are shown below.

In the P1 scenario sink use is minimal, highlighted by an end to land based anthropogenic emissions and the subsequent development of the land as an enhanced sink from mid-century on, at about 5 Gt per annum drawdown of carbon dioxide. P1 makes no use of geological storage. By contrast, the P4 scenario makes very extensive use of geological sinks with BECCS playing a substantial role even as land based emissions are eventually reigned in. But why is there such a difference in sink use between these scenarios?
A deeper dive into the four stories reveals an interesting trend – an almost linear relationship linking cumulative sink capacity to 2100 with the growth in final energy demand (measured as the increase in 2050 demand over 2010 demand).

This trend points to two aspects of the energy transition which are in turn related to the two reasons for needing sinks outlined above;
- As energy demand increases and emissions rise from sectors of the economy where no large scale mitigation solutions currently exist, perhaps a sector like aviation, greater and greater sink capacity will be required.
- With energy demand rising quickly and a starting dependency on fossil fuels to meet that demand, the carbon budget that equates to 1.5°C is exceeded well before the point of net-zero emissions, which then means extensive sink capacity is required to remove this carbon from the atmosphere and meet 1.5°C later in the century.
That then brings into focus the question of energy demand. In the Energy Transformation Scenarios released recently by Shell, all three scenarios show rising energy demand through the century, although in the Sky 1.5 story this is curtailed from the 2070s onwards due mainly to efficiency practices and rapid electrification (which can also lead to greater efficiency).
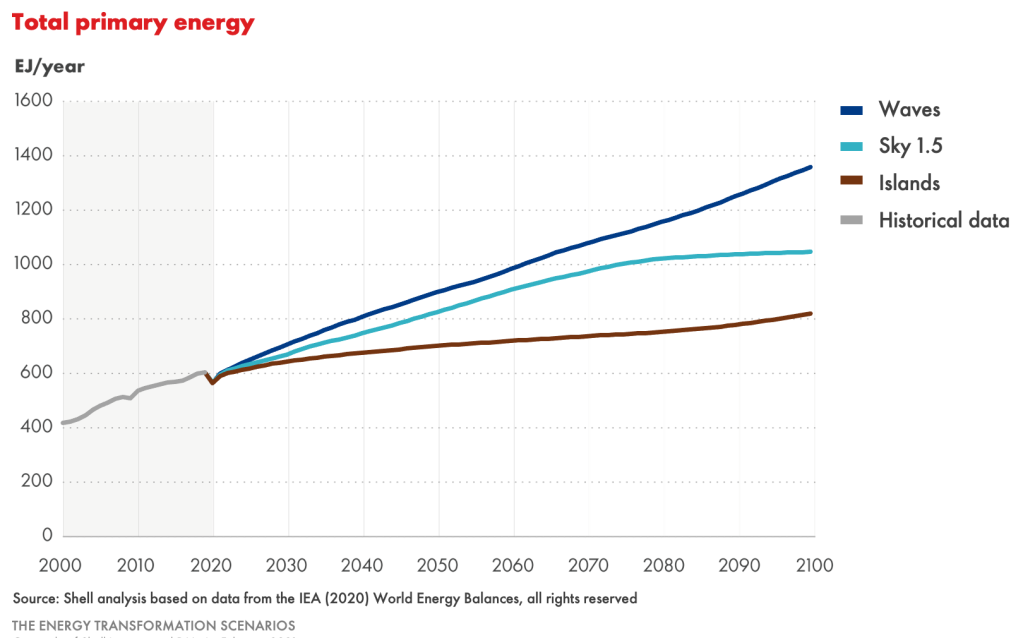
Energy demand growth across all three Shell scenarios contrasts with the IPCC range, where the P1 archetype imagines a fall in energy demand. But a fall in energy demand over the next thirty years is in sharp contrast with history, where energy demand has only ever risen, even as very significant efficiency gains have spread throughout society.
For comparison, over the last 30 years (to 2019), world total primary energy grew by 68%. This derives from GDP growth of 180%, and a Shell assessment of total energy service growth of 130%. In a discussion on energy growth, it is important to focus on non-OECD countries, because that is where the relationship of GDP growth to energy service growth is strongest. OECD countries are not far from the point where energy service growth is matched by energy service efficiency improvement and hence energy demand stays flat. In the last 30 years, non-OECD primary energy growth was over 80% of the global total and in the next 30 years we may see non-OECD growth making up almost all of the global energy demand increase. But this is the portion of the word where population increase continues in many countries and where access to energy is growing at a rapid rate. This in turn creates new demand for energy services. In short, we are more likely to underestimate energy demand than overestimate it.
There are also other reasons for continued energy demand growth.
- Efficiency rebound on a macro scale is widespread and often not recognised. For example, when I was growing up in Australia in the 1960s, air conditioned cars hardly existed. I still remember when we lived outside the country in an American community (in SE Asia) in 1967 and I got in my first air conditioned car; I really couldn’t believe such a thing was possible. Today, you can’t buy a car without air conditioning. So in the 1960s we had maybe 50 million upscale cars globally with expensive inefficient air conditioners, but now we have over one billion cars with cheap efficient air conditioners. That’s lots more energy than the 1960s.
- Society continues to find and adopt new and interesting ways to consume energy. When energy is available, it gets used. Think how much more energy intensive our life is compared to our parents or grandparents. One example – millions of people around the world are starting to adopt and make use of Bitcoin, but the media recently reported that Bitcoin ‘mining’ at various sites around the world collectively consumes more electricity than the Netherlands.
- Adoption of new technologies can lead to explosive growth in energy services. The internet and all the servers and devices connected to it is one such example. It didn’t really exist thirty years ago, at least not as a consumer service.
Even with significant energy efficiency improvement over time, the Sky 1.5 scenario which is comparable with IPCC P1 to P4 in terms of temperature rise (i.e. 1.5°C), sees final energy demand increasing by 49% in 2050 relative to 2010. The scenario also employs significant sink capacity globally to achieve an outcome of 1.5°C in 2100. The cumulative total across nature based and manmade carbon dioxide removal to 2100 is around 1,000 Gt for Sky 1.5. Plotting this on the chart above, we see that although Sky 1.5 has a similar, but slightly higher final energy demand than P4, it makes less use of sink capacity by about 20%.

Both Sky 1.5 and IPCC P4 demonstrate the considerable sink capacity required for a 1.5°C outcome, unless energy demand can be significantly curtailed in the near term and rapid solutions found and deployed for current hard-to-abate sectors.
Note: Scenarios don’t describe what will happen, or what should happen, rather they explore what could happen. Scenarios are not predictions, strategies or business plans. Please read the full Disclaimer here.


Average Rating